
🏠 Home Buying Still Out of Reach for Many 🏠
It is cheaper to rent than buy in 45 of the 50 most populous U.S. cities. San Jose, California, is the most expensive city for buying a home, whereas Pittsburgh is the most affordable.
The 50 Most Populous Cities, Ranked by Price-to-Rent Ratio | Average Rent vs. Mortgage Payment | Best Cities for Buying | Best Cities for Renting | Is Home Price Growth Outpacing Rent Growth? | Months of Average Rent Needed to Buy a Home by Metro | Rent vs. Buy Calculator | FAQ
The U.S. housing market has experienced a year-over-year decline in home sales as home prices continue to outpace inflation. This trend has led to an affordable housing crisis that is similar to what’s happening around the world in Portugal, the Netherlands, and countless other countries.
Many Americans have chosen to rent while saving to buy a home, which is still considered part of the “American dream” that is promised to our youth. However, with the average home price increasing 70% more than average rent prices across the U.S. since 2016, it begs the question: Is owning a home still attainable for renters?
This study aims to identify the cities where it’s most affordable to make the jump from renting to buying a home. Specifically, we highlight the cities where it is more financially sound to purchase a home and where renting is the better option.
We analyzed the 50 most populous U.S. metros based on their price-to-rent ratios. The price-to-rent ratio is calculated by dividing the median home price by the median annual rent. A price-to-rent ratio of 15 or less means it’s better to buy. A price-to-rent ratio of 21 or more means it’s better to rent.
Our data comes from Zillow, the Federal Reserve, the U.S. Census Bureau, the Federal Housing Financing Agency, Realtor.com, Redfin, and Zumper. Typical rent and home prices are based on the median price in the U.S.
Key Rent vs. Buy Statistics 🔑
- Typical U.S. home prices have increased 70% more than typical rent prices since 2016. Jump to section 👇
- It is cheaper to rent than buy in 45 of the 50 most populous U.S. cities based on monthly rent and mortgage payment comparisons.👇
- The city with the highest price-to-rent ratio is San Jose, California (38), while the lowest is Pittsburgh (12).👇
- San Jose has the highest rent prices ($3,181), while Milwaukee has the lowest ($1,214).👇
- San Jose has the highest home prices ($1,431,676), while Pittsburgh has the lowest ($188,418).👇
- Rent prices are within 20% of mortgage payments in 22 cities in our study.👇
- Nationally, the average for monthly mortgage payments is $174 more than the average rent payment in the U.S — it’s $872 more in major metros.👇
- You can save an average of $592 renting per month rather than owning a home in New York City.👇
- On the other hand, you can save an average of $107 per month owning a home rather than renting in New Orleans.👇
- Nationally, it would take 214.7 months of rent to save up for the typical home purchase price — almost 18 years’ worth of rent.👇
The 50 Most Populous Metros, Ranked by Price-to-Rent Ratio
| # | City | 2023 Price-to-Rent Ratio* | 2023 Typical Monthly Rent Price | 2023 Typical Home Value | 2016 Typical Monthly Rent Price | 2016 Typical Home Value |
| – | Major Metro Average | 18 | $1,863 | $417,936 | $1,301 | $245,384 |
| 1 | Pittsburgh, PA | 12 | $1,333 | $188,419 | $1,019 | $122,402 |
| 2 | New Orleans, LA | 12 | $1,594 | $227,190 | $1,261 | $168,831 |
| 3 | Chicago, IL | 12 | $1,874 | $279,202 | $1,468 | $188,180 |
| 4 | Cleveland, OH | 12 | $1,340 | $200,015 | $960 | $121,697 |
| 5 | Memphis, TN | 13 | $1,489 | $223,386 | $956 | $116,573 |
| 6 | Miami, FL | 13 | $2,767 | $444,989 | $1,663 | $220,578 |
| 7 | Detroit, MI | 14 | $1,370 | $223,022 | $930 | $125,547 |
| 8 | Oklahoma City, OK | 14 | $1,306 | $217,508 | $990 | $133,316 |
| 9 | St. Louis, MO | 14 | $1,309 | $221,941 | $951 | $140,387 |
| 10 | Tampa, FL | 14 | $2,090 | $359,669 | $1,174 | $165,096 |
| 11 | Cincinnati, OH | 15 | $1,435 | $250,941 | $942 | $144,068 |
| 12 | Birmingham, AL | 15 | $1,305 | $230,845 | $945 | $135,025 |
| 13 | Philadelphia, PA | 15 | $1,794 | $318,245 | $1,335 | $199,692 |
| 14 | Indianapolis, IN | 15 | $1,457 | $258,824 | $960 | $135,077 |
| 15 | Houston, TX | 15 | $1,640 | $298,164 | $1,304 | $184,858 |
| 16 | New York, NY | 15 | $3,068 | $559,117 | $2,457 | $358,569 |
| 17 | Louisville, KY | 15 | $1,275 | $235,497 | $868 | $141,978 |
| 18 | Atlanta, GA | 15 | $1,930 | $357,947 | $1,132 | $174,846 |
| 19 | Orlando, FL | 16 | $2,011 | $378,390 | $1,213 | $189,854 |
| 20 | Buffalo, NY | 16 | $1,214 | $229,955 | $828 | $135,782 |
| 21 | Hartford, CT | 16 | $1,614 | $306,316 | $1,201 | $218,964 |
| 22 | Virginia Beach, VA | 16 | $1,628 | $312,653 | $1,156 | $215,438 |
| 23 | San Antonio, TX | 16 | $1,487 | $286,897 | $1,074 | $165,406 |
| 24 | Columbus, OH | 16 | $1,463 | $283,924 | $987 | $157,576 |
| 25 | Baltimore, MD | 16 | $1,741 | $342,658 | $1,399 | $245,778 |
| 26 | Jacksonville, FL | 17 | $1,750 | $350,862 | $1,076 | $168,867 |
| 27 | Kansas City, MO | 17 | $1,359 | $273,315 | $926 | $151,427 |
| 28 | Charlotte, NC | 17 | $1,763 | $355,551 | $1,102 | $172,124 |
| 29 | Dallas, TX | 17 | $1,776 | $365,604 | $1,195 | $196,886 |
| 30 | Boston, MA | 17 | $2,949 | $608,413 | $2,246 | $384,631 |
| 31 | Richmond, VA | 18 | $1,563 | $332,515 | $1,057 | $196,458 |
| 32 | Minneapolis, MN | 18 | $1,609 | $349,879 | $1,223 | $222,779 |
| 33 | Riverside, CA | 18 | $2,490 | $546,495 | $1,495 | $296,548 |
| 34 | Providence, RI | 18 | $1,897 | $417,548 | $1,191 | $245,606 |
| 35 | Nashville, TN | 19 | $1,868 | $417,731 | $1,230 | $200,179 |
| 36 | Las Vegas, NV | 19 | $1,789 | $400,804 | $1,080 | $215,764 |
| 37 | Phoenix, AZ | 19 | $1,863 | $434,447 | $1,033 | $223,469 |
| 38 | Milwaukee, WI | 19 | $1,214 | $283,175 | $933 | $182,521 |
| 39 | Washington, DC | 20 | $2,182 | $523,094 | $1,785 | $371,398 |
| 40 | Raleigh, NC | 20 | $1,713 | $418,058 | $1,152 | $226,277 |
| 41 | Sacramento, CA | 21 | $2,227 | $552,756 | $1,425 | $332,373 |
| 42 | Austin, TX | 22 | $1,811 | $484,644 | $1,262 | $270,018 |
| 43 | San Diego, CA | 24 | $2,950 | $835,466 | $1,859 | $488,684 |
| 44 | Portland, OR | 24 | $1,861 | $528,379 | $1,311 | $321,243 |
| 45 | Denver, CO | 25 | $1,950 | $573,571 | $1,409 | $344,412 |
| 46 | Los Angeles, CA | 25 | $2,905 | $871,775 | $2,024 | $502,651 |
| 47 | Salt Lake City, UT | 25 | $1,723 | $520,842 | $1,087 | $269,415 |
| 48 | Seattle, WA | 26 | $2,170 | $689,871 | $1,511 | $374,462 |
| 49 | San Francisco, CA | 30 | $3,076 | $1,094,639 | $2,550 | $716,477 |
| 50 | San Jose, CA | 38 | $3,181 | $1,431,676 | $2,692 | $889,027 |
| *Price-to-rent ratio is calculated by dividing the median home price by the median annual rent. A price-to-rent ratio of 15 or less means it’s better to buy. A price-to-rent ratio of 21 or more means it’s better to rent. | ||||||
It is cheaper to rent than buy in 45 of the 50 most populous U.S. cities based on the price differences between annual rent and monthly mortgage payments. However, there are some pretty stark differences between major metros in terms of rent and home prices.
For example, San Jose, California, has the highest rent prices ($3,181), while Milwaukee has the lowest ($1,214). San Jose also has the highest home prices ($1,431,676), while Pittsburgh has the lowest ($188,419).
Given that both rent and home prices around the country are high, Americans should look at price-to-rent ratios to determine whether they can reasonably save to make a purchase in a certain metro.
18 Best Cities for Buying a Home
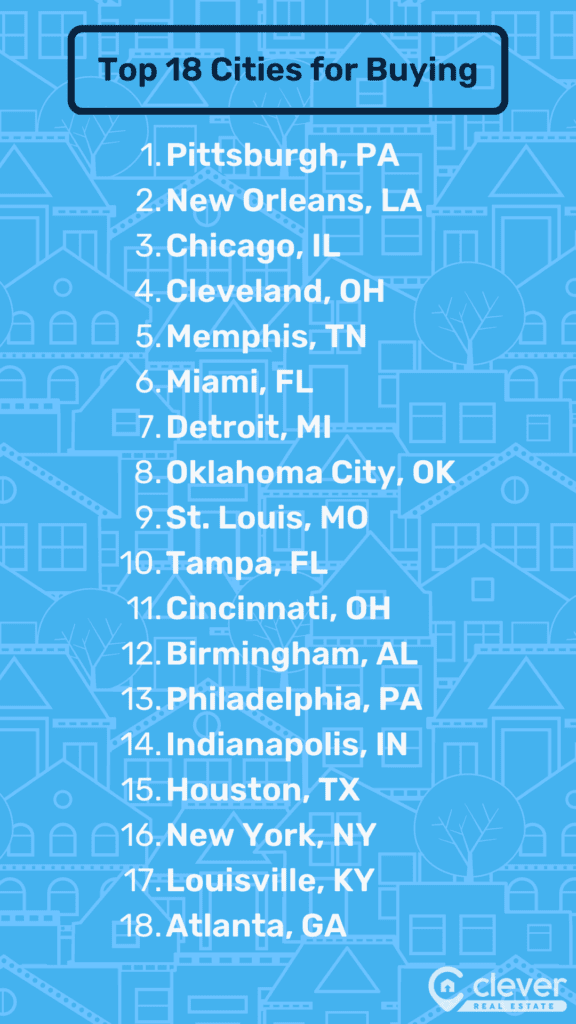
The top 18 cities for buying are all cities that have a price-to-rent ratio lower of 15 or lower, which is a good sign that renters are better off buying a home than continuing to rent long-term.
Pittsburgh, while tied with other cities such as New Orleans, Chicago, and Cleveland for the lowest price-to-rent ratio of 12, is the best city for buyers because it also has the lowest home prices of all cities we studied ($188,419). New York City has the highest home prices at $559,117, but given that rent is typically $3,068 a month, residents are actually better off springing for a mortgage than paying rent to a landlord.
The South has long been considered the most affordable region in the country, and based on the price-to-rent ratio, that remains true. Half of the top 18 cities for buying are located in the South: New Orleans, Memphis, Miami, Oklahoma City, Tampa, Birmingham, Houston, Louisville, and Atlanta.
Although Miami and Tampa have had some of the highest increases in home prices in the country over the past year, they’re still better options for buying over renting. They’re also more affordable than one of the most popular cities in the country, Los Angeles, where the typical home value is $871,775, compared to $444,989 in Miami and $359,669 in Tampa.
| City | 2023 Price-to-Rent Ratio | 2023 Typical Annual Rent | 2023 Typical Home Value | |
| 1 | Pittsburgh, PA | 12 | $15,994 | $188,419 |
| 2 | New Orleans, LA | 12 | $19,129 | $227,190 |
| 3 | Chicago, IL | 12 | $22,487 | $279,202 |
| 4 | Cleveland, OH | 12 | $16,080 | $200,015 |
| 5 | Memphis, TN | 13 | $17,867 | $223,386 |
| 6 | Miami, FL | 13 | $33,208 | $444,989 |
| 7 | Detroit, MI | 14 | $16,440 | $223,022 |
| 8 | Oklahoma City, OK | 14 | $15,677 | $217,508 |
| 9 | St. Louis, MO | 14 | $15,713 | $221,941 |
| 10 | Tampa, FL | 14 | $25,082 | $359,669 |
| 11 | Cincinnati, OH | 15 | $17,216 | $250,941 |
| 12 | Birmingham, AL | 15 | $15,663 | $230,845 |
| 13 | Philadelphia, PA | 15 | $21,528 | $318,245 |
| 14 | Indianapolis, IN | 15 | $17,488 | $258,824 |
| 15 | Houston, TX | 15 | $19,686 | $298,164 |
| 16 | New York, NY | 15 | $36,816 | $559,117 |
| 17 | Louisville, KY | 15 | $15, 300 | $235,497 |
| 18 | Atlanta, GA | 15 | $23,160 | $357,947 |
10 Best Cities for Renting Compared to Buying
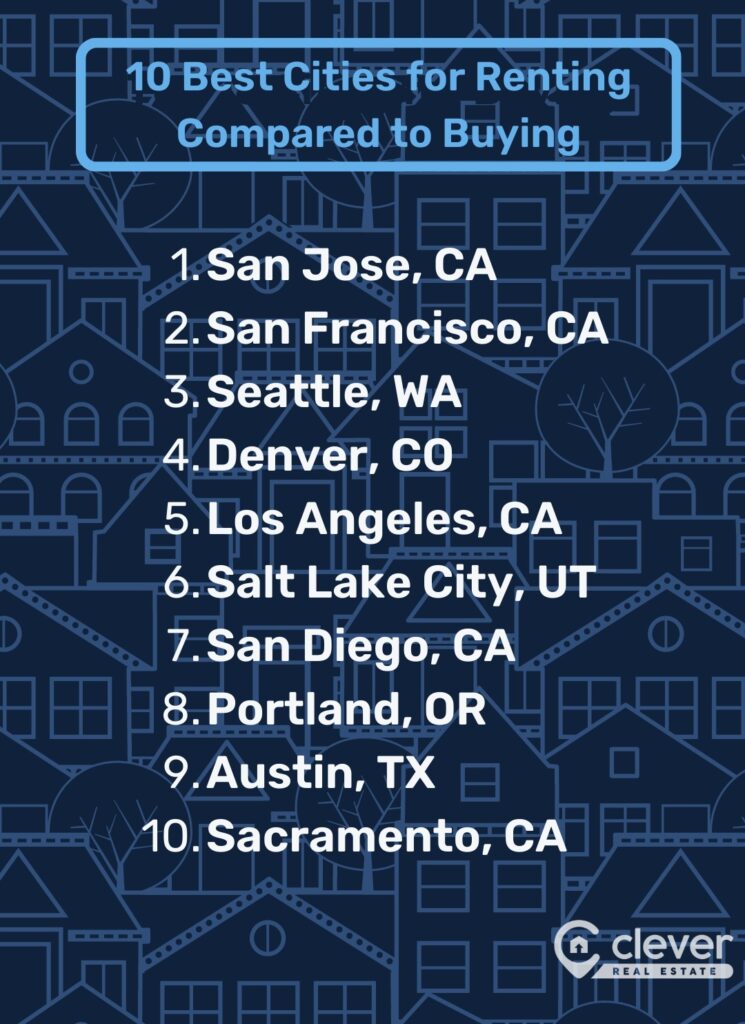
There are 10 cities in our study with price-to-rent ratios of 21 or above, meaning it’s better to rent. San Jose has the highest price-to-rent ratio in the study at 38. Due to its exorbitant home prices — typically $1,431,676 — it’s demonstrably easier to rent in that area.
With home prices that high, most renters might not have much of a choice. Unfortunately for renters in San Jose, rent prices are also extremely high. The typical monthly rent in the Bay Area is $3,181 — nearly 3x more than Pittsburgh’s typical monthly rent ($1,214), the lowest in the study.
It’s also useful to compare cities with high price-to-rent ratios to those that are considered “mid-range,” between 15 and 21. For example, Milwaukee has the lowest rent ($1,214) of any other city in the study, but its price-to-rent ratio of 19 places it in the middle of the pack.
A ratio between 15 and 21 may indicate that the decision to buy or rent depends more on individual circumstances, such as long-term goals and specific housing needs that aren’t easily addressed by a simple cost analysis.
Of the cities with a price-to-rent ratio of 21 or higher, Salt Lake City has the lowest annual rent costs. In Salt Lake City, renters can expect to pay just $26,079 a year, nearly $17,500 less than they would in the most expensive city, San Jose.
| City | 2023 Price-to-Rent Ratio | 2023 Typical Annual Rent | 2023 Typical Home Value | |
| 1 | San Jose, CA | 38 | $38,178 | $1,431,676 |
| 2 | San Francisco, CA | 30 | $36,918 | $1,094,639 |
| 3 | Seattle, WA | 26 | $26,039 | $689,871 |
| 4 | Denver, CO | 25 | $23,403 | $573,571 |
| 5 | Los Angeles, CA | 25 | $34,858 | $871,775 |
| 6 | Salt Lake City, UT | 25 | $20,679 | $520,842 |
| 7 | San Diego, CA | 24 | $35,398 | $835,466 |
| 8 | Portland, OR | 24 | $22,331 | $528,379 |
| 9 | Austin, TX | 22 | $21,737 | $484,644 |
| 10 | Sacramento, CA | 21 | $26,729 | $552,756 |
Typical Rent vs. Mortgage Payment by Metro
Another way to compare rent and home prices is by looking at monthly mortgage payments versus monthly rent. However, this comparison does not take into account other factors, such as the potential increase in a home’s value or additional bills beyond rent and mortgage payments.
Interest rates are a crucial factor in determining if mortgage or rent payments are more affordable. If interest rates fall to 4% on average, mortgage payments will become cheaper than rent in 30 cities in our study. Additionally, we found that in 22 of the 50 metropolitan areas we analyzed, rent prices are within 20% of mortgage payments. This indicates that in nearly half of American cities, the decision to rent or buy is pretty tough.
The three cities with the largest differences in monthly mortgage payments and rent are all in notoriously expensive California: Los Angeles ($2,802), San Francisco ($4,089), and San Jose ($6,190). This means that in Los Angeles, renters can actually save nearly $3,000 a month instead of springing for a mortgage.
In New Orleans, Pittsburgh, Chicago, Cleveland, and Memphis, it’s actually cheaper month over month to pay the typical mortgage payment than rent. New Orleans has the most savings with the typical monthly mortgage payment costing $107 less than the typical rent.
Across the 50 most populous cities, it’s still cheaper to rent than buy, with renters saving an average of $872 a month compared to those making mortgage payments. Accounting for more suburban and rural areas as well, that average drops down to a $174 difference.
| Typical Monthly Rent | Typical Monthly Mortgage Payment With 6.8% Interest* | Monthly Difference | ||
| – | Major Metro Average | $1,863 | $2,736 | $872 |
| 1 | New Orleans, LA | $1,594 | $1,487 | -$107 |
| 2 | Pittsburgh, PA | $1,333 | $1,233 | -$100 |
| 3 | Chicago, IL | $1,874 | $1,828 | -$46 |
| 4 | Cleveland, OH | $1,340 | $1,309 | -$31 |
| 5 | Memphis, TN | $1,489 | $1,462 | -$27 |
| 6 | Detroit, MI | $1,370 | $1,460 | $90 |
| 7 | Oklahoma City, OK | $1,306 | $1,424 | $118 |
| 8 | St. Louis, MO | $1,309 | $1,453 | $144 |
| 9 | Miami, FL | $2,767 | $2,913 | $146 |
| 10 | Birmingham, AL | $1,305 | $1,511 | $206 |
| 11 | Cincinnati, OH | $1,435 | $1,643 | $208 |
| 12 | Indianapolis, IN | $1,457 | $1,694 | $237 |
| 13 | Tampa, FL | $2,090 | $2,354 | $264 |
| 14 | Louisville, KY | $1,275 | $1,542 | $267 |
| 15 | Philadelphia, PA | $1,794 | $2,083 | $289 |
| 16 | Buffalo, NY | $1,214 | $1,505 | $291 |
| 17 | Houston, TX | $1,640 | $1,952 | $311 |
| 18 | San Antonio, TX | $1,487 | $1,878 | $391 |
| 19 | Hartford, CT | $1,614 | $2,005 | $391 |
| 20 | Columbus, OH | $1,463 | $1,859 | $396 |
| 21 | Atlanta, GA | $1,930 | $2,343 | $413 |
| 22 | Virginia Beach, VA | $1,628 | $2,047 | $419 |
| 23 | Kansas City, MO | $1,359 | $1,789 | $430 |
| 24 | Orlando, FL | $2,011 | $2,477 | $466 |
| 25 | Baltimore, MD | $1,741 | $2,243 | $502 |
| 26 | Jacksonville, FL | $1,750 | $2,297 | $547 |
| 27 | Charlotte, NC | $1,763 | $2,327 | $564 |
| 28 | New York, NY | $3,068 | $3,660 | $592 |
| 29 | Richmond, VA | $1,563 | $2,177 | $614 |
| 30 | Dallas, TX | $1,776 | $2,393 | $617 |
| 31 | Milwaukee, WI | $1,214 | $1,854 | $640 |
| 32 | Minneapolis, MN | $1,609 | $2,290 | $681 |
| 33 | Las Vegas, NV | $1,789 | $2,624 | $835 |
| 34 | Providence, RI | $1,897 | $2,733 | $836 |
| 35 | Nashville, TN | $1,868 | $2,734 | $866 |
| 36 | Phoenix, AZ | $1,863 | $2,844 | $981 |
| 37 | Raleigh, NC | $1,713 | $2,737 | $1,024 |
| 38 | Boston, MA | $2,949 | $3,983 | $1,034 |
| 39 | Riverside, CA | $2,490 | $3,577 | $1,087 |
| 40 | Washington, DC | $2,182 | $3,424 | $1,242 |
| 41 | Austin, TX | $1,811 | $3,172 | $1,361 |
| 42 | Sacramento, CA | $2,227 | $3,618 | $1,391 |
| 43 | Portland, OR | $1,861 | $3,459 | $1,598 |
| 44 | Salt Lake City, UT | $1,723 | $3,409 | $1,686 |
| 45 | Denver, CO | $1,950 | $3,755 | $1,805 |
| 46 | Seattle, WA | $2,170 | $4,516 | $2,346 |
| 47 | San Diego, CA | $2,950 | $5,469 | $2,519 |
| 48 | Los Angeles, CA | $2,905 | $5,707 | $2,802 |
| 49 | San Francisco, CA | $3,076 | $7,165 | $4,089 |
| 50 | San Jose, CA | $3,181 | $9,372 | $6,191 |
Is Home Price Growth Outpacing Rent Price Growth?
In every single market we studied, home price growth outpaced rent growth from January 2016 to January 2023. Nationally, home price growth has outpaced rent price growth by nearly 70% from 2016 to 2023.
However, from January 2022 to January 2023, rent growth outpaced housing price growth in half of the cities in our study. Cities such as San Francisco (-1.6% difference) and New Orleans (-0.2%) actually experienced slight decreases in home prices as their housing markets slowly deflated. At the same time, rent prices in both cities have increased slightly more than the recommended 2%, which is most affordable for renters.
Florida is home to the four cities — Miami, Jacksonville, Orlando, and Tampa — with the highest increases in home prices.
However, the city with the highest growth in rent in the past year is Louisville, Kentucky, at 10%. This is largely due to residents from more expensive cities moving to Louisville. Ironically, this has driven up rent prices, but for economists, this is a classic case of high demand driving up prices.
| Rent Growth, 2016 to 2023 | Home Price Growth, 2016 to 2023 | Rent Growth, 2022 to 2023 | Home Price Growth, 2022 to 2023 | ||
| – | Major Metro Average | 45.2% | 72.9% | 6.1% | 6.86% |
| 1 | San Francisco, CA | 20.7% | 52.8% | 3.7% | -1.6% |
| 2 | New Orleans, LA | 26.5% | 34.6% | 2.7% | -0.2% |
| 3 | Sacramento, CA | 56.3% | 66.3% | 1.9% | 0.7% |
| 4 | Portland, OR | 41.9% | 64.5% | 6.8% | 2.2% |
| 5 | Salt Lake City, UT | 58.5% | 93.3% | 5.9% | 2.5% |
| 6 | Denver, CO | 38.4% | 66.5% | 4.9% | 2.6% |
| 7 | Seattle, WA | 43.7% | 84.2% | 4.4% | 2.9% |
| 8 | San Jose, CA | 18.2% | 61% | 6.3% | 3.1% |
| 9 | Minneapolis, MN | 31.5% | 57.1% | 4.1% | 3.2% |
| 10 | Washington, DC | 22.3% | 40.8% | 4.3% | 3.3% |
| 11 | Phoenix, AZ | 80.3% | 94.4% | 1.1% | 3.6% |
| 12 | Austin, TX | 43.5% | 79.5% | 3.8% | 3.7% |
| 13 | Los Angeles, CA | 43.5% | 73.4% | 6% | 3.9% |
| 14 | Baltimore, MD | 24.5% | 39.4% | 2.6% | 4.3% |
| 15 | Las Vegas, NV | 65.6% | 85.8% | -1% | 4.5% |
| 16 | Chicago, IL | 27.6% | 48.4% | 7.6% | 4.5% |
| 17 | New York, NY | 24.9% | 55.9% | 8.5% | 4.8% |
| 18 | Pittsburgh, PA | 30.8% | 53.9% | 6.3% | 5.1% |
| 19 | San Diego, CA | 58.7% | 71% | 8.3% | 5.2% |
| 20 | Boston, MA | 31.3% | 58.2% | 7.6% | 5.4% |
| 21 | Riverside, CA | 66.6% | 84.3% | 4.6% | 6.3% |
| 22 | Milwaukee, WI | 30.1% | 55.2% | 6.8% | 6.3% |
| 23 | Virginia Beach, VA | 40.8% | 45.1% | 6.2% | 6.5% |
| 24 | Louisville, KY | 46.9% | 65.9% | 10% | 6.5% |
| 25 | Detroit, MI | 47.3% | 77.6% | 5.7% | 6.6% |
| 26 | Cincinnati, OH | 52.3% | 74.2% | 9.9% | 7.8% |
| 27 | St. Louis, MO | 37.6% | 58.1% | 7.7% | 7.9% |
| 28 | Indianapolis, IN | 51.8% | 91.6% | 9.8% | 8.1% |
| 29 | Buffalo, NY | 46.6% | 69.4% | 9.1% | 8.1% |
| 30 | San Antonio, TX | 38.4% | 73.5% | 4.8% | 8.2% |
| 31 | Philadelphia, PA | 34.3% | 59.4% | 4.9% | 8.4% |
| 32 | Kansas City, MO | 46.9% | 80.5% | 9% | 8.6% |
| 33 | Dallas, TX | 48.6% | 85.7% | 5.6% | 8.7% |
| 34 | Houston, TX | 25.8% | 61.3% | 4.3% | 8.7% |
| 35 | Raleigh, NC | 48.7% | 84.8% | 5.8% | 8.8% |
| 36 | Providence, RI | 59.3% | 70% | 8.6% | 8.8% |
| 37 | Birmingham, AL | 38.1% | 71% | 4.9% | 9.1% |
| 38 | Cleveland, OH | 39.6% | 64.4% | 8.1% | 9.2% |
| 39 | Atlanta, GA | 70.5% | 104.7% | 5.4% | 9.9% |
| 40 | Charlotte, NC | 60% | 106.6% | 7.6% | 10% |
| 41 | Memphis, TN | 55.8% | 91.6% | 7.2% | 10% |
| 42 | Nashville, TN | 51.9% | 108.7% | 6.4% | 10.1% |
| 43 | Columbus, OH | 48.2% | 80.2% | 7.1% | 10.3% |
| 44 | Richmond, VA | 47.9% | 69.3% | 6.8% | 10.4% |
| 45 | Hartford, CT | 34.4% | 39.9% | 6.7% | 10.4% |
| 46 | Oklahoma City, OK | 31.9% | 63.2% | 5.5% | 11.1% |
| 47 | Tampa, FL | 78.1% | 117.9% | 6.8% | 12.3% |
| 48 | Orlando, FL | 65.8% | 99.3% | 7.5% | 12.5% |
| 49 | Jacksonville, FL | 62.7% | 107.8% | 5.3% | 13.8% |
| 50 | Miami, FL | 66.4% | 101.7% | 9.6% | 16% |
Months of Typical Rent Needed to Buy a Home by Metro
By looking at the number of months of rent it would take to buy a home, renters can get a sense of how much they could be saving by owning a home instead of renting. Prospective buyers, on the other hand, can get a sense of how much they would need to save for a down payment and how much they would need to budget for monthly mortgage payments.
Pittsburgh is where it makes the most sense to buy because it only takes 141.4 months of rent to buy a home. However, that’s still 12 years.
Where does it make the least sense to buy? You guessed it — San Jose, where it takes 450 months — or nearly 38 years — of rent to buy a home.
On average for the 50 most populous metros, it takes an average of 214.7 months of rent to buy a home in the U.S. This is sobering because the average American renter probably isn’t thrilled about a home costing nearly 18 years of rent. It doesn’t get much better once we include Americans in suburbia and rural areas — the national average is still 166.3 months of rent — almost 14 years.
| Metro | Months of Typical Rent to Buy a Home | |
| – | Major Metro Average | 214.7 |
| 1 | Pittsburgh, PA | 141.4 |
| 2 | New Orleans, LA | 142.5 |
| 3 | Chicago, IL | 149 |
| 4 | Cleveland, OH | 149.3 |
| 5 | Memphis, TN | 150 |
| 6 | Miami, FL | 160.8 |
| 7 | Detroit, MI | 162.8 |
| 8 | Oklahoma City, OK | 166.5 |
| 9 | St. Louis, MO | 169.5 |
| 10 | Tampa, FL | 172.1 |
| 11 | Cincinnati, OH | 174.9 |
| 12 | Birmingham, AL | 176.9 |
| 13 | Philadelphia, PA | 177.4 |
| 14 | Indianapolis, IN | 177.6 |
| 15 | Houston, TX | 181.8 |
| 16 | New York, NY | 182.2 |
| 17 | Louisville, KY | 184.7 |
| 18 | Atlanta, GA | 185.5 |
| 19 | Orlando, FL | 188.2 |
| 20 | Buffalo, NY | 189.4 |
| 21 | Hartford, CT | 189.8 |
| 22 | Virginia Beach, VA | 192.1 |
| 23 | San Antonio, TX | 193 |
| 24 | Columbus, OH | 194.1 |
| 25 | Baltimore, MD | 196.8 |
| 26 | Jacksonville, FL | 200.5 |
| 27 | Kansas City, MO | 201.1 |
| 28 | Charlotte, NC | 201.6 |
| 29 | Dallas, TX | 205.9 |
| 30 | Boston, MA | 206.3 |
| 31 | Richmond, VA | 212.7 |
| 32 | Minneapolis, MN | 217.4 |
| 33 | Riverside, CA | 219.4 |
| 34 | Providence, RI | 220.1 |
| 35 | Nashville, TN | 223.7 |
| 36 | Las Vegas, NV | 224.1 |
| 37 | Phoenix, AZ | 233.2 |
| 38 | Milwaukee, WI | 233.4 |
| 39 | Washington, DC | 239.7 |
| 40 | Raleigh, NC | 244.1 |
| 41 | Sacramento, CA | 248.2 |
| 42 | Austin, TX | 267.6 |
| 43 | San Diego, CA | 283.2 |
| 44 | Portland, OR | 283.9 |
| 45 | Denver, CO | 294.1 |
| 46 | Los Angeles, CA | 300.1 |
| 47 | Salt Lake City, UT | 302.2 |
| 48 | Seattle, WA | 317.9 |
| 49 | San Francisco, CA | 355.8 |
| 50 | San Jose, CA | 450 |
Overall, there are stark contrasts in housing affordability around the country. Unfortunately, it appears that it ranges from bad to much worse. Our results show that in most major metros, it could take over a decade and a half to realistically save up for a home.
These findings are particularly significant in the context of the affordable housing crisis in the country. As housing prices continue to rise, it is becoming increasingly difficult for many Americans to afford homeownership.
To address the affordable housing crisis, policymakers can increase the supply of affordable housing, implement rent control measures, and provide financial assistance to low-income families. In the meantime, potential homebuyers should carefully consider their financial situation and explore all available options before deciding whether to rent or buy a home.
Rent vs. Buy Calculator
Analyzing the price-to-rent ratio for where you want to live is a great first step in deciding whether it’s time to buy a home or continue renting. It’s also helpful to take a closer look at your budget and ideal down payment to really visualize what your monthly mortgage payment will look like compared to renting.
This calculator takes into account a variety of factors, including typical rent, typical home prices, down payment percentage, and loan term length, with a set interest rate based on the national average. Whether you’re a first-time homebuyer or looking to relocate, this calculator can provide valuable insight to aid in your decision-making process.
Methodology
Data sources for this study include Zillow (Zillow Home Value Index and Zillow Observed Rent Index), the Federal Reserve, the U.S. Census Bureau, the Federal Housing Financing Agency (FHFA), Realtor.com, Redfin, and Zumper.
About Home Bay
Where your real estate voyage begins. Since 2014, Home Bay has helped thousands of readers confidently sail through their next home sale or purchase. In 2021, Home Bay was acquired by Clever Real Estate, a free agent-matching service that has helped consumers save more than $160 million on real estate fees. Research by Home Bay’s Data Center has been cited by The New York Times, CNBC, MarketWatch, NPR, Apartment Therapy, Yahoo Finance, Black Enterprise, and more.
More Research from Home Bay


Articles You Might Like


Frequently Asked Questions
It is better to buy a home if you live in an area where your typical monthly mortgage payment would be lower than the typical rent. It is better to rent if you live in an area with an expensive housing market where renters would have to save up for more than five years to afford a down payment on a typical home.
The price-to-rent ratio is a measure used in real estate to evaluate the relative affordability of buying versus renting a property. It is calculated by dividing the median home price by the median annual rent. A price-to-rent ratio of 15 or less means it’s better to buy. A price-to-rent ratio of 21 or more means it’s better to rent.
The ideal or healthy price-to-rent ratio varies depending on the location and market conditions. Generally, a ratio of 15 or below is favorable for buyers, while a ratio above 21 suggests renting may be more cost-effective. However, other factors, such as duration of stay, interest rates, tax benefits, and maintenance costs, should also be considered.