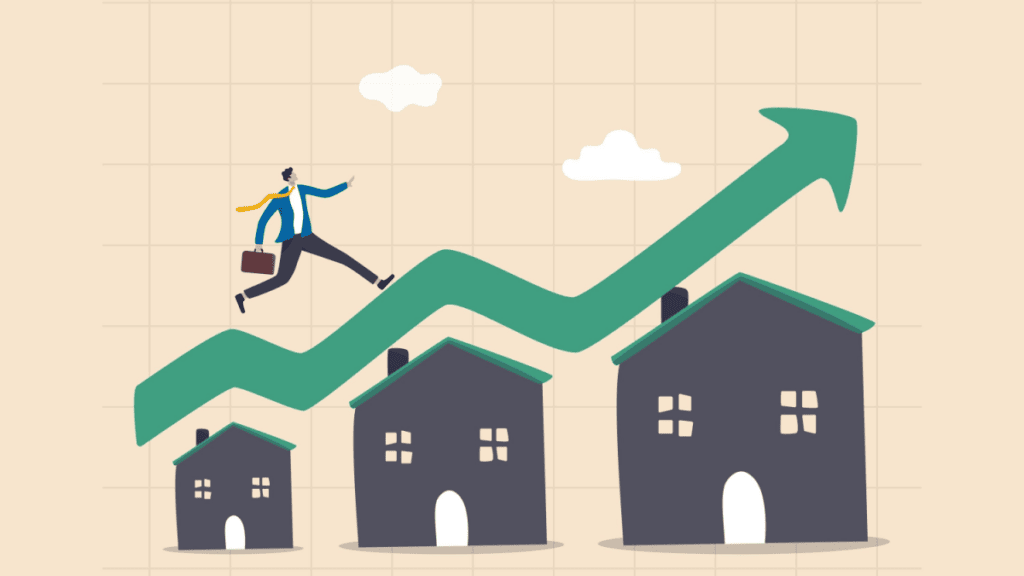
💰 How have home prices and income changed over time? 💰
House prices across the U.S. have soared 162% since 2000, while income has increased only 78%.
Home Prices vs. Income | House-Price-to-Income Ratio | Most Affordable Metros | Least Affordable Metros
The American Dream of homeownership is becoming even less attainable as home prices have risen exponentially faster than income over the past two decades.
Despite the housing market crash in 2008, the median U.S. home price climbed 162% between 2000 and 2022 — the last full year for which housing and income data is available.
Low interest rates and limited housing stock helped fuel the market’s recovery and pushed home prices higher, but wages failed to keep pace.
To afford the median-priced home of $433,100, Americans need an annual income of roughly $166,600. But the median household earns just $74,580 — only 45% of the recommended amount.
To discover how these factors affect potential home buyers, we analyzed publicly available data from the Federal Reserve, the National Association of Realtors, and the U.S. Census.
We found that the divide between home prices and income has caused the house-price-to-income ratio to greatly exceed what many financial experts consider healthy.
The average house-price-to-income ratio has climbed to 5.8 nationwide — more than double the recommended ratio of 2.6.
In other words, buying a home should cost about 2.6x what the average American makes in a year. In reality, it costs 5.8x the median household income — making homeownership an increasingly elusive dream for today’s home buyers.
🏠 Home Prices vs. Income Statistics
- Home values have soared 162% since 2000, while income has increased only 78%.
- House prices have increased 2x faster than income since 1985 and 2.1x faster than income since 2000.
- If home prices had grown at the same rate as income since 2000, the median U.S. home would cost nearly $294,000 — about 32% less than today’s price of $433,100.
- To afford a home, Americans need an average income of roughly $166,600, but the median household income is just $74,580.
- The average house-price-to-income ratio in the U.S. is 5.8, more than double the 2.6 experts recommend.
- None of the 50 most-populous metros in the U.S. have a home-price-to-income ratio that’s equal to or below the recommended 2.6.
- Pittsburgh has the lowest home-price-to-income ratio at 3.2, followed by Buffalo (3.5) and Cleveland (3.5).
- The least affordable metros for housing are unsurprisingly concentrated in California: San Jose (12.1), San Francisco (10.4), San Diego (9.5), and Los Angeles (9).
Home Prices Have Grown 2x Faster Than Income Since 2000
Homeownership has long been considered an attractive investment because it extends many economic benefits, including the opportunity to build generational wealth.
As a result, homes are consistently in demand. But as the U.S. population grows, new home construction is limited by a finite amount of land on which to build — increasing the cost of existing homes throughout the years.
Between 1985 and 2022 — the last full year for which data is available — the median home sale price in the U.S. climbed 423%, while median household income rose just 216%.
During that time, home values grew about 2x faster than income. If home prices had grown at the same rate as income since 1985, the median U.S. home would cost roughly $261,650 instead of $433,100.
Home prices have exceeded income even more rapidly since 2000, a decade marked by an unparalleled rise in home prices.
Since then, home values have soared 162% — from $165,300 to $433,100. Meanwhile, annual income has merely crawled upward. Wages have increased a modest 78% — from $41,990 to $74,580.
With home prices growing 2.1x faster than income since 2000, Americans struggle to find properties they can comfortably afford to own.
If home prices had grown at the same rate as income since 2000, the median U.S. home would cost roughly $294,000 — about 32% less than today’s price of $433,100.
None of the Top 50 U.S. Metros Have a ‘Healthy’ Home-Price-to-Income Ratio
Home prices have dipped slightly in 2023 as buyer demand wanes amid rising interest rates. But buyers aren’t feeling much relief.
The median U.S. home costs $433,100. For Americans making the median household income of $74,580, buying a home costs 5.8x their annual salary.
For comparison, financial experts suggest buyers spend no more than 2.6x their annual income on a home. However, the national house-price-to-income ratio has been higher than the recommended 2.6 every year since 1985.
Entire generations have struggled to afford homes, but supercharged home prices in recent years have become a much bigger problem for young buyers.
When the average boomer bought a home in 1985, the house-price-to-income ratio was 3.5. The ratio increased slightly to 3.9 in 2000, when many Gen X buyers purchased homes.
Millennials, however, must surmount a much higher hurdle to achieve homeownership. Not only is the current house-price-to-income ratio of 5.8 double the recommended ratio of 2.6, it’s 66% higher than it was in 1985 and 49% higher than it was in 2000.
As wages fall behind rapidly rising home prices, Americans view the housing market with increasing hopelessness. Nearly 3 in 4 renters (72%) say they’ll never have enough money to own a home.
This pessimism is pervasive among buyers, who have struggled to find an affordable place to call home. In 2021, only six of the 50 largest U.S. metros had a house-price-to-income ratio that was below or equal to the recommended 2.6:
- Pittsburgh (2.2)
- Cleveland (2.4)
- Oklahoma City (2.5)
- St. Louis (2.5)
- Birmingham (2.5)
- Cincinnati (2.6)
In subsequent years, once-affordable cities have succumbed to market pressure. In 2023, none of the 50 largest U.S. metros have a home-price-to-income ratio below or equal to the recommended 2.6.
The 25 Most Affordable U.S. Metros Based on the House-Price-to-Income Ratio
Home values across the U.S. have skyrocketed in recent years, but some metros have managed to keep price growth from burgeoning to unaffordable levels — an impressive feat in today’s market.
Buyers will find the most affordable homes in Pittsburgh, where the house-price-to-income ratio is 3.2 — about 45% lower than the national average of 5.8.
Although home values in Pittsburgh are still on the rise, income has actually grown faster than home prices in the past 12 months, making Steel City one of the most favorable markets for buyers.
While the median home price in Pittsburgh has increased 0.3% — from $225,200 to $225,900 — in the past year, income has jumped 6% in the same time period. The median household now earns about $70,607 — up from $66,609 — increasing residents’ purchasing power.
The 10 most affordable major U.S. metros based on the house-price-to-income ratio are:
- Pittsburgh (3.2)
- Buffalo (3.5)
- Cleveland (3.5)
- St. Louis (3.6)
- Detroit (3.7)
- Oklahoma City (3.7)
- Louisville (3.9)
- Cincinnati (3.9)
- Indianapolis (4.1)
- Hartford (4.2)
Overall, the 10 most affordable cities have an average home-price-to-income ratio of 3.7 — about 36% lower than the national average.
| Rank | City | Home-Price-to- Income Ratio | Median Home Value | Median Household Income |
| 1 | Pittsburgh, PA | 3.2 | $225,900 | $70,607 |
| 2 | Buffalo, NY | 3.5 | $236,800 | $68,698 |
| 3 | Cleveland, OH | 3.5 | $228,700 | $65,198 |
| 4 | St. Louis, MO | 3.6 | $266,200 | $74,531 |
| 5 | Detroit, MI | 3.7 | $265,300 | $71,265 |
| 6 | Oklahoma City, OK | 3.7 | $247,600 | $66,301 |
| 7 | Louisville, KY | 3.9 | $270,900 | $69,547 |
| 8 | Cincinnati, OH | 3.9 | $294,200 | $75,062 |
| 9 | Indianapolis, IN | 4.1 | $311,200 | $75,824 |
| 10 | Hartford, CT | 4.2 | $357,800 | $85,723 |
| 11 | Philadelphia, PA | 4.2 | $352,900 | $84,123 |
| 12 | Minneapolis, MN | 4.2 | $386,700 | $91,341 |
| 13 | Columbus, OH | 4.3 | $327,500 | $75,777 |
| 14 | Chicago, IL | 4.4 | $362,600 | $82,914 |
| 15 | Baltimore, MD | 4.4 | $399,800 | $90,505 |
| 16 | Kansas City, MO | 4.4 | $333,900 | $75,280 |
| 17 | Atlanta, GA | 4.4 | $376,500 | $84,876 |
| 18 | Memphis, TN | 4.5 | $287,900 | $64,008 |
| 19 | Virginia Beach, VA | 4.6 | $339,700 | $74,556 |
| 20 | Houston, TX | 4.7 | $348,300 | $74,863 |
| 21 | New Orleans, LA | 4.7 | $287,100 | $61,602 |
| 22 | Birmingham, AL | 4.7 | $315,800 | $67,242 |
| 23 | Dallas, TX | 4.7 | $389,800 | $82,823 |
| 24 | San Antonio, TX | 4.7 | $334,100 | $70,538 |
| 25 | Richmond, VA | 4.9 | $395,000 | $81,388 |
The 25 Least Affordable U.S. Metros Based on the House-Price-to-Income Ratio
The most expensive housing markets are, unsurprisingly, concentrated in California. The state has five cities represented in the 10 most unaffordable metros for housing.
With a house-price-to-income ratio of 12.1, San Jose is the least affordable U.S. metro, followed by San Francisco (10.4), San Diego (9.5), and Los Angeles (9).
In San Jose, the median household earns $148,900 a year but needs 12.1x that amount to afford the median home, which costs $1.8 million.
In other words, the typical San Jose home buyer would have to save for 12 years to afford a home. That’s about 2x longer than the average U.S. home buyer would need and nearly 4x longer than the average buyer would need in Pittsburgh — the most affordable city for housing.
The 10 least affordable major U.S. metros based on the house-price-to-income ratio are:
- San Jose (12.1)
- San Francisco (10.4)
- San Diego (9.5)
- Los Angeles (9.0)
- Miami (8.6)
- Seattle (7.4)
- Boston (7.0)
- New York (6.9)
- Riverside (6.9)
- Denver (6.8)
The 10 most expensive metros for housing may have an average home-price-to-income ratio of 8.5 — 47% higher than the national average — but there are signs the housing bubble in those cities is starting to deflate.
As high interest rates increase the cost of borrowing, many buyers are reluctant to take out mortgages on expensive homes. Demand for pricey residences has cooled, causing a slight dip in home values.
In the past 12 months, the house-price-to-income ratio has actually decreased in all 10 of the most expensive cities. San Francisco experienced the greatest decline, with the home-price-to-income ratio falling from 13 to 10.4.
| Rank | City | Home-Price-to- Income Ratio | Median Home Value | Median Household Income |
| 1 | San Jose, CA | 12.1 | $1,800,000 | $148,900 |
| 2 | San Francisco, CA | 10.4 | $1,335,000 | $128,151 |
| 3 | San Diego, CA | 9.5 | $942,400 | $98,928 |
| 4 | Los Angeles, CA | 9.0 | $789,400 | $87,743 |
| 5 | Miami, FL | 8.6 | $605,000 | $70,769 |
| 6 | Seattle, WA | 7.4 | $793,300 | $106,909 |
| 7 | Boston, MA | 7.0 | $734,200 | $104,299 |
| 8 | New York, NY | 6.9 | $629,000 | $91,562 |
| 9 | Riverside, CA | 6.9 | $570,000 | $82,803 |
| 10 | Denver, CO | 6.8 | $674,500 | $98,975 |
| 11 | Portland, OR | 6.7 | $599,400 | $89,312 |
| 12 | Las Vegas, NV | 6.4 | $449,600 | $70,797 |
| 13 | Orlando, FL | 6.1 | $435,000 | $71,857 |
| 14 | Salt Lake City, UT | 6.0 | $546,900 | $91,891 |
| 15 | Tampa, FL | 5.9 | $409,900 | $69,290 |
| 16 | Sacramento, CA | 5.9 | $530,000 | $89,237 |
| 17 | Providence, RI | 5.7 | $462,300 | $81,784 |
| 18 | Phoenix, AZ | 5.6 | $464,200 | $82,884 |
| 19 | Milwaukee, WI | 5.5 | $387,400 | $70,898 |
| 20 | Washington, DC | 5.4 | $629,000 | $117,432 |
| 21 | Austin, TX | 5.3 | $496,300 | $94,604 |
| 22 | Charlotte, NC | 5.2 | $403,100 | $77,154 |
| 23 | Raleigh, NC | 5.1 | $471,600 | $92,739 |
| 24 | Nashville, TN | 5.0 | $401,300 | $80,034 |
| 25 | Jacksonville, FL | 5.0 | $390,900 | $77,583 |
Methodology
Current home price data by metro area in the form of median sale price of existing single-family homes was provided by the National Association of Realtors. For recent household income data by metro, we relied on the U.S. Census’ American Community Survey 2021 and 2022 reports.
For historical national home price data, we relied on the Federal Reserve’s historical data set on nationwide median home prices. Similarly, for historical national income data, we used the Federal Reserve’s data set on historical median income.
About Home Bay
Where your real estate voyage begins. Since 2014, Home Bay has helped thousands of readers confidently sail through their next home sale or purchase. In 2021, Home Bay was acquired by Clever Real Estate, a free agent-matching service that has helped consumers save more than $160 million on real estate fees. Research by Home Bay’s Data Center has been cited by The New York Times, CNBC, MarketWatch, NPR, Apartment Therapy, Yahoo Finance, Black Enterprise, and more.
More Research From Home Bay
Articles You May Like
FAQs
House prices across the U.S. have soared 162% since 2000, while income has only increased 78%. Learn more.
The average house-price-to-income ratio has climbed to 5.8 nationwide — more than double the recommended ratio of 2.6. Learn more.
Financial advisors recommend spending no more than 2.6 times your annual income on a home. If you make $60,000 a year, you can afford a home that costs about $156,000. Learn more.


