
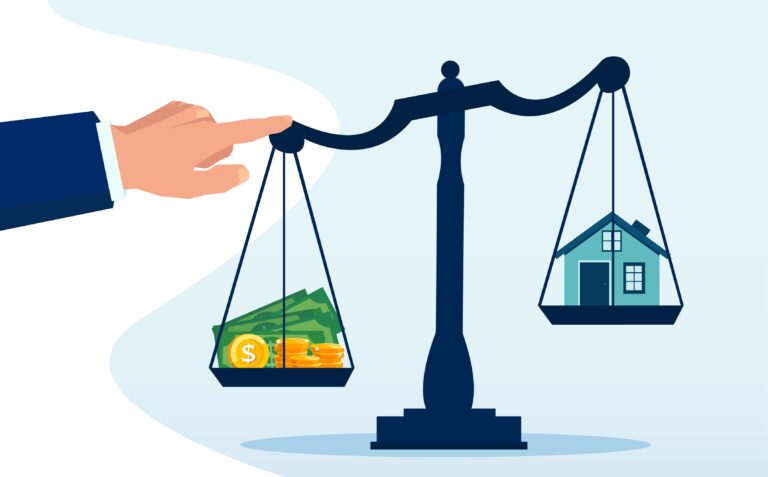
🏡 📈 How do home values affect homelessness? 📈 🏡
Cities with above-average home values have homeless rates about 2.5x higher than cities with lower-than-average home values.
High Home Values and Homelessness | The Worst City for Housing | Golden State Struggles | 12 Worst Metros for Homelessness | Rent Prices | Poverty Rates | Lowest Homeless Rates | Outlier Cities
America’s affordable housing crisis manifests in different ways, but none are as visual, visceral, or tragic as the prevalence of homelessness. About 582,000 Americans were homeless in 2022 — equivalent to the population of Wyoming.
With a state’s worth of people living without reliable housing, it’s clear that the U.S. has a problem. Portugal, a country whose gross domestic product equals just 1% of U.S. GDP, has a homeless rate half that of America.
Although experiences vary, it’s only logical to wonder about the overarching causes of homelessness. New research from Home Bay highlights a clear correlation between a lack of affordable housing and high rates of homelessness in America’s cities.
Analysis of the 50 largest U.S. metro areas reveals that cities with home values above the national average have homeless rates 2.5x higher than metro areas with lower-than-average home values.
In certain cities, the comparison is especially jarring. San Jose, California, has the country’s highest rate of homelessness and highest home values — with a homeless rate of 637 per 100,000 residents and a typical home value of $1.39 million.
To learn more about the relationship between high housing prices and homelessness, Home Bay analyzed data from Zillow and the Department of Housing and Urban Development to see how America’s cities compare.
Home Values vs. Homelessness Statistics 🏡
- Metro areas with above-average home values have homeless rates about 2.5x that of metro areas with below-average home values. Jump to section 👇
- San Jose, California, has the highest rate of homelessness and the highest home values of any major metro in the U.S.👇
- San Jose’s homeless rate is 3.5x the national average, while home values are 4.5x the national average. The typical home value in San Jose is $1.39 million.
- California’s six largest metros have homeless rates 2.8x higher than the national average and home values nearly 3x the national average — $866,256 vs. $301,466.👇
- Of the seven U.S. metros with the highest homeless rates, five are in California, along with Seattle and New York City.
- In the 12 metros with the highest homeless rates, the typical home value is $670,363 — 2.2x higher than the typical home value of $308,275 in the 38 cities with lower-than-average homeless rates. 👇
- The 12 metros with the highest homeless rates have rent prices 43% higher than metros with lower-than-average homelessness — $2,274 vs. $1,596. 👇
- Although both home values and rent prices are correlated with high homelessness, the connection is stronger for home values.
- Unlike home and rent prices, high poverty rates are actually associated with lower home values and homelessness. 👇
- In metros where less than 10% of the population lives in poverty, homeless rates and home values are 2x higher than in metros where 10% or more of residents live under the poverty line — indicating that poverty rates may not be a reliable metric for gauging housing affordability.
Cities With High Home Values Have More Homelessness
Analysis shows a strong correlation between expensive homes and high rates of homelessness in the country’s 50 largest metro areas.
Metro areas with home values higher than the typical U.S. home ($301,466) have homeless rates 2.5x higher than areas with lower-than-average home values.
The 28 metros with higher-than-average home values have an average homeless rate of 216 per 100,000 people. Meanwhile, the 22 metros with lower-than-average home values have an average homeless rate of 82 per 100,000 people.
The explanation is fairly straightforward. High prices are an indicator of high demand, and high demand comes from scarcity, such as a low supply of affordable housing.
Although most Americans believe the main causes of homelessness are substance use or mental health challenges, some researchers put more emphasis on the overall cost of housing. Home Bay’s findings are consistent with that thesis.
The chart below shows how areas with high housing prices tend to have higher rates of homelessness.
Plotting cities’ homeless rates and home values reveals some interesting outliers.
For example, Boston ranks sixth nationally for highest home values but 28th for homelessness — indicating Boston may be doing something right regarding policies to help with homelessness.
However, its New England neighbor, Hartford, Connecticut, ranks 11th for homelessness but 32nd for home values — suggesting that even reasonable housing costs aren’t alleviating homelessness.
| City | Home Value Rank | Typical Home Value | Homeless Rate Rank | Homeless Rate per 100,000 People |
| United States | – | $301,466 | – | 175.5 |
| San Jose, CA | 1 | $1,388,268 | 1 | 636.8 |
| San Francisco, CA | 2 | $1,112,005 | 2 | 508.8 |
| Los Angeles, CA | 3 | $839,426 | 3 | 501 |
| San Diego, CA | 4 | $794,389 | 6 | 378.3 |
| Seattle, WA | 5 | $670,672 | 5 | 408.9 |
| Boston, MA | 6 | $577,160 | 28 | 90.6 |
| Denver, CO | 7 | $559,309 | 10 | 231.6 |
| Sacramento, CA | 8 | $549,079 | 4 | 468 |
| New York, NY | 9 | $533,524 | 7 | 371.9 |
| Portland, OR | 10 | $517,139 | 8 | 310.7 |
| Riverside, CA | 11 | $514,369 | 15 | 142.9 |
| Salt Lake City, UT | 12 | $508,195 | 13 | 165.9 |
| Washington, DC | 13 | $506,268 | 18 | 123.1 |
| Austin, TX | 14 | $467,403 | 17 | 134.2 |
| Phoenix, AZ | 15 | $419,470 | 12 | 182.5 |
| Raleigh, NC | 16 | $384,348 | 23 | 105.9 |
| Miami, FL | 17 | $383,767 | 39 | 76.8 |
| Providence, RI | 18 | $383,720 | 26 | 94.1 |
| Las Vegas, NV | 19 | $383,673 | 9 | 246.2 |
| Nashville, TN | 20 | $379,259 | 21 | 113.6 |
| Minneapolis, MN | 21 | $338,959 | 16 | 139.2 |
| Dallas, TX | 22 | $336,437 | 38 | 78.3 |
| Orlando, FL | 23 | $336,326 | 35 | 79.9 |
| Baltimore, MD | 24 | $328,445 | 27 | 92.1 |
| Atlanta, GA | 25 | $325,680 | 46 | 52.7 |
| Charlotte, NC | 26 | $323,297 | 43 | 65.2 |
| Tampa, FL | 27 | $320,187 | 14 | 150.1 |
| Jacksonville, FL | 28 | $308,334 | 24 | 99.4 |
| Richmond, VA | 29 | $301,135 | 47 | 52.6 |
| Philadelphia, PA | 30 | $293,721 | 19 | 119.1 |
| Virginia Beach, VA | 31 | $293,623 | 29 | 90.3 |
| Hartford, CT | 32 | $277,401 | 11 | 192 |
| Houston, TX | 33 | $274,314 | 49 | 43.3 |
| Chicago, IL | 34 | $267,173 | 41 | 74.3 |
| Milwaukee, WI | 35 | $266,314 | 45 | 53.1 |
| San Antonio, TX | 36 | $265,249 | 20 | 115.1 |
| Columbus, OH | 37 | $257,529 | 30 | 88.9 |
| Kansas City, MO | 38 | $251,635 | 34 | 81.1 |
| Indianapolis, IN | 39 | $239,447 | 33 | 82.8 |
| Cincinnati, OH | 40 | $232,775 | 48 | 47.8 |
| New Orleans, LA | 41 | $227,523 | 25 | 96.2 |
| Louisville, KY | 42 | $221,129 | 32 | 84.1 |
| Buffalo, NY | 42 | $212,730 | 42 | 73.6 |
| Birmingham, AL | 44 | $211,578 | 31 | 84.6 |
| Detroit, MI | 45 | $209,249 | 44 | 60.9 |
| St. Louis, MO | 46 | $205,694 | 36 | 79.6 |
| Memphis, TN | 47 | $203,110 | 37 | 79 |
| Oklahoma City, OK | 48 | $195,828 | 22 | 106.5 |
| Cleveland, OH | 49 | $183,199 | 40 | 75.8 |
| Pittsburgh, PA | 50 | $179,357 | 50 | 41.8 |
San Jose Has the Country’s Highest Home Values and Highest Rates of Homelessness
No metro struggles as much with housing prices and homelessness as the home of Silicon Valley.
San Jose’s homeless rate — 637 per 100,000 people — is 3.5x the national average. In addition, the city’s home values are 4.5x the national average, with a typical home value of $1.39 million.
Although California’s metros already have higher homeless rates than the typical U.S. city, tech salaries and housing prices in San Jose have made the city especially unaffordable for those without high incomes.
In fact, another recent Home Bay study found that San Jose is the worst city for home buyers because it takes 450 months of average rent — 37.5 years — to buy the average home.
California Cities Struggle Disproportionately With Home Values and Homelessness
The connection between home values and homelessness is readily apparent in California metros.
Six of the country’s 50 largest metros are in California. With an average homeless rate of 499 per 100,000 people, the rate in these cities is 2.8x higher than the U.S. average — 176 per 100,000 people.
These metros also have home values nearly 3x the U.S. average — $866,256 vs. $301,466.
The four cities with the highest homeless rates nationwide are San Jose, San Francisco, Los Angeles, and Sacramento. San Diego ranks sixth nationally, and Riverside ranks 15th.
California has one of the highest costs of living in the country, further exacerbating existing economic inequalities. In addition to a desirable climate, California is considered one of the better states for access to services for homeless populations, which can incentivize people without reliable housing to stay.
Cities With the Highest Homeless Rates Have Home Values More Than Double the National Average
The relationship between high home values and high homeless rates is not one-sided. When we look at cities with the highest homeless rates, they too tend to have the highest home values.
In fact, metro areas with above-average homeless rates have typical home values about 2.2x higher than the national average.
Of the 50 metros in our analysis, 12 have homeless rates above the national average of 176 per 100,000 people. These 12 metros have an average home value of $670,363, while the typical home across the country is worth $301,466.
| City | Homeless Rate Rank | Homeless Rate per 100,000 People | Home Value Rank | Typical Home Value |
| United States | – | 175.5 | – | $301,466 |
| San Jose, CA | 1 | 636.8 | 1 | $1,388,268 |
| San Francisco, CA | 2 | 508.8 | 2 | $1,112,005 |
| Los Angeles, CA | 3 | 501 | 3 | $839,426 |
| Sacramento, CA | 4 | 468 | 8 | $549,079 |
| Seattle, WA | 5 | 408.9 | 5 | $670,672 |
| San Diego, CA | 6 | 378.3 | 4 | $794,389 |
| New York, NY | 7 | 371.9 | 9 | $533,524 |
| Portland, OR | 8 | 310.7 | 10 | $517,139 |
| Las Vegas, NV | 9 | 246.2 | 19 | $383,673 |
| Denver, CO | 10 | 231.6 | 7 | $559,309 |
| Hartford, CT | 11 | 192 | 32 | $277,401 |
| Phoenix, AZ | 12 | 182.5 | 15 | $419,470 |
Rent Prices Are $700 Higher in Metros With the Highest Homeless Rates
The 12 metros with the highest homeless rates have above-average home values, as well as above-average rent prices.
The typical rent price in the 12 metros with above-average homeless rates is $2,274 a month. That’s nearly $700 more expensive than the typical rent price of $1,596 in cities with lower-than-average homeless rates.
Both high home values and high rent prices are associated with higher homelessness, but the correlation is stronger between home values and homelessness.
That may be because landlords and real estate investors compensate for high property prices by charging higher rents, but high rents don’t necessarily cause higher home values. Factors influencing rent prices, such as local rental market regulations and varying goals among individual landlords, don’t impact home values to the same extent.
| City | Homeless Rate Rank | Homeless Rate per 100,000 People | Rent Price Rank | Typical Rent Price |
| United States | – | 175.5 | – | $1,843 |
| San Jose, CA | 1 | 636.8 | 1 | $2,993 |
| San Francisco, CA | 2 | 508.8 | 2 | $2,968 |
| Los Angeles, CA | 3 | 501 | 4 | $2,742 |
| Sacramento, CA | 4 | 468 | 9 | $2,187 |
| Seattle, WA | 5 | 408.9 | 11 | $2,079 |
| San Diego, CA | 6 | 378.3 | 6 | $2,724 |
| New York, NY | 7 | 371.9 | 3 | $2,827 |
| Portland, OR | 8 | 310.7 | 22 | $1,742 |
| Las Vegas, NV | 9 | 246.2 | 17 | $1,807 |
| Denver, CO | 10 | 231.6 | 14 | $1,859 |
| Hartford, CT | 11 | 192 | 34 | $1,513 |
| Phoenix, AZ | 12 | 182.5 | 15 | $1,843 |
| Salt Lake City, UT | 13 | 165.9 | 28 | $1,628 |
| Tampa, FL | 14 | 150.1 | 12 | $1,957 |
| Riverside, CA | 15 | 142.9 | 8 | $2,382 |
| Minneapolis, MN | 16 | 139.2 | 32 | $1,546 |
| Austin, TX | 17 | 134.2 | 20 | $1,745 |
| Washington, DC | 18 | 123.1 | 10 | $2,092 |
| Philadelphia, PA | 19 | 119.1 | 23 | $1,711 |
| San Antonio, TX | 20 | 115.1 | 36 | $1,419 |
| Nashville, TN | 21 | 113.6 | 18 | $1,756 |
| Oklahoma City, OK | 22 | 106.5 | 46 | $1,238 |
| Raleigh, NC | 23 | 105.9 | 29 | $1,619 |
| Jacksonville, FL | 24 | 99.4 | 26 | $1,661 |
| New Orleans, LA | 25 | 96.2 | 31 | $1,553 |
| Providence, RI | 26 | 94.1 | 19 | $1,747 |
| Baltimore, MD | 27 | 92.1 | 24 | $1,697 |
| Boston, MA | 28 | 90.6 | 5 | $2,740 |
| Virginia Beach, VA | 29 | 90.3 | 33 | $1,534 |
| Columbus, OH | 30 | 88.9 | 38 | $1,366 |
| Birmingham, AL | 31 | 84.6 | 44 | $1,244 |
| Louisville, KY | 32 | 84.1 | 48 | $1,158 |
| Indianapolis, IN | 33 | 82.8 | 39 | $1,328 |
| Kansas City, MO | 34 | 81.1 | 43 | $1,247 |
| Orlando, FL | 35 | 79.9 | 13 | $1,870 |
| St. Louis, MO | 36 | 79.6 | 47 | $1,216 |
| Memphis, TN | 37 | 79 | 37 | $1,389 |
| Dallas, TX | 38 | 78.3 | 25 | $1,681 |
| Miami, FL | 39 | 76.8 | 7 | $2,524 |
| Cleveland, OH | 40 | 75.8 | 45 | $1,240 |
| Chicago, IL | 41 | 74.3 | 21 | $1,742 |
| Buffalo, NY | 42 | 73.6 | 50 | $1,113 |
| Charlotte, NC | 43 | 65.2 | 27 | $1,639 |
| Detroit, MI | 44 | 60.9 | 41 | $1,297 |
| Milwaukee, WI | 45 | 53.1 | 49 | $1,136 |
| Atlanta, GA | 46 | 52.7 | 16 | $1,832 |
| Richmond, VA | 47 | 52.6 | 35 | $1,464 |
| Cincinnati, OH | 48 | 47.8 | 40 | $1,305 |
| Houston, TX | 49 | 43.3 | 30 | $1,573 |
| Pittsburgh, PA | 50 | 41.8 | 42 | $1,254 |
Cities With Low Poverty Rates Have More Homelessness on Average
Unlike with home values, our analysis found that low poverty rates are not a reliable indicator of low homelessness. Just the opposite — cities with low poverty rates surprisingly see more homelessness.
Metros in which fewer than 10% of residents live in poverty have homeless rates and home values 2x higher than metros where 10% or more of residents live in poverty.
Nine of the 50 metros we analyzed have poverty rates under 10%. These cities have an average homeless rate of 265 per 100,000 people — compared to 134 per 100,000 people in cities with 10% or more of the population living in poverty.
The typical home value across these nine metros is about $656,941 — 95% higher than the other 41 cities with higher poverty rates, which have a typical home value of $337,716.
For example, San Jose has the country’s lowest poverty rate and the highest rate of homelessness. New Orleans has a poverty rate 2.7x higher than San Jose but a homeless rate 6.6x lower than San Jose.
That may indicate that, despite low incomes, residents in areas with high poverty rates can more easily afford housing because of a lower cost of living. It may also indicate a need to use caution when using a city’s poverty rate to gauge an area’s economic reality.
| City | Highest Poverty Rate Rank | Share of Residents Below Poverty Level | Homeless Rate Rank | Homeless Rate per 100,000 People | Home Value Rank | Typical Home Value |
| United States | – | 12.80% | – | 175.5 | – | $301,466 |
| San Jose, CA | 50 | 6.90% | 1 | 636.8 | 1 | $1,388,268 |
| Minneapolis, MN | 49 | 8.00% | 16 | 139.2 | 21 | $338,959 |
| Salt Lake City, UT | 48 | 8.20% | 13 | 165.9 | 12 | $508,195 |
| Denver, CO | 47 | 8.40% | 10 | 231.6 | 7 | $559,309 |
| Seattle, WA | 46 | 8.60% | 5 | 408.9 | 5 | $670,672 |
| Washington, DC | 45 | 8.70% | 18 | 123.1 | 13 | $506,268 |
| San Francisco, CA | 44 | 9.00% | 2 | 508.8 | 2 | $1,112,005 |
| Boston, MA | 43 | 9.30% | 28 | 90.6 | 6 | $577,160 |
| Kansas City, MO | 42 | 9.70% | 34 | 81.1 | 38 | $251,635 |
| Portland, OR | 41 | 10.00% | 8 | 310.7 | 10 | $517,139 |
| Hartford, CT | 40 | 10.10% | 11 | 192 | 32 | $277,401 |
| Raleigh, NC | 39 | 10.10% | 23 | 105.9 | 16 | $384,348 |
| Austin, TX | 38 | 10.30% | 17 | 134.2 | 14 | $467,403 |
| Richmond, VA | 37 | 10.50% | 47 | 52.6 | 29 | $301,135 |
| San Diego, CA | 36 | 10.60% | 6 | 378.3 | 4 | $794,389 |
| Nashville, TN | 35 | 10.60% | 21 | 113.6 | 20 | $379,259 |
| Indianapolis, IN | 34 | 10.60% | 33 | 82.8 | 39 | $239,447 |
| St. Louis, MO | 33 | 10.60% | 36 | 79.6 | 46 | $205,694 |
| Baltimore, MD | 32 | 10.70% | 27 | 92.1 | 24 | $328,445 |
| Virginia Beach, VA | 31 | 10.70% | 29 | 90.3 | 31 | $293,623 |
| Charlotte, NC | 30 | 10.70% | 43 | 65.2 | 26 | $323,297 |
| Dallas, TX | 29 | 11.00% | 38 | 78.3 | 22 | $336,437 |
| Phoenix, AZ | 28 | 11.10% | 12 | 182.5 | 15 | $419,470 |
| Pittsburgh, PA | 27 | 11.20% | 50 | 41.8 | 50 | $179,357 |
| Chicago, IL | 26 | 11.50% | 41 | 74.3 | 34 | $267,173 |
| Providence, RI | 25 | 11.60% | 26 | 94.1 | 18 | $383,720 |
| Atlanta, GA | 24 | 11.60% | 46 | 52.7 | 25 | $325,680 |
| Sacramento, CA | 23 | 11.80% | 4 | 468 | 8 | $549,079 |
| Louisville, KY | 22 | 12.10% | 32 | 84.1 | 42 | $221,129 |
| Cincinnati, OH | 21 | 12.10% | 48 | 47.8 | 40 | $232,775 |
| Jacksonville, FL | 20 | 12.20% | 24 | 99.4 | 28 | $308,334 |
| Columbus, OH | 19 | 12.20% | 30 | 88.9 | 37 | $257,529 |
| Riverside, CA | 18 | 12.30% | 15 | 142.9 | 11 | $514,369 |
| Philadelphia, PA | 17 | 12.30% | 19 | 119.1 | 30 | $293,721 |
| Milwaukee, WI | 16 | 12.40% | 45 | 53.1 | 35 | $266,314 |
| New York, NY | 15 | 12.90% | 7 | 371.9 | 9 | $533,524 |
| Orlando, FL | 14 | 12.90% | 35 | 79.9 | 23 | $336,326 |
| Tampa, FL | 13 | 13.00% | 14 | 150.1 | 27 | $320,187 |
| Cleveland, OH | 12 | 13.00% | 40 | 75.8 | 49 | $183,199 |
| Los Angeles, CA | 11 | 13.10% | 3 | 501 | 3 | $839,426 |
| Miami, FL | 10 | 13.30% | 39 | 76.8 | 17 | $383,767 |
| San Antonio, TX | 9 | 13.40% | 20 | 115.1 | 36 | $265,249 |
| Detroit, MI | 8 | 13.40% | 44 | 60.9 | 45 | $209,249 |
| Buffalo, NY | 7 | 13.50% | 42 | 73.6 | 43 | $212,730 |
| Houston, TX | 6 | 14.10% | 49 | 43.3 | 33 | $274,314 |
| Birmingham, AL | 5 | 14.30% | 31 | 84.6 | 44 | $211,578 |
| Oklahoma City, OK | 4 | 14.50% | 22 | 106.5 | 48 | $195,828 |
| Las Vegas, NV | 3 | 15.10% | 9 | 246.2 | 19 | $383,673 |
| Memphis, TN | 2 | 16.90% | 37 | 79 | 47 | $203,110 |
| New Orleans, LA | 1 | 18.40% | 25 | 96.2 | 41 | $227,523 |
A Look at Cities With the Lowest Homeless Rates
Despite the commonality of homelessness across the country, some cities have achieved low rates of homelessness, in part, because of the relative affordability of housing.
The 15 cities with the lowest rates of homelessness are all in the eastern half of the U.S., with seven in the Midwest. Of course, climate plays a role, but housing prices do as well. These 15 metros average a typical home price of $260,282 — 14% lower than the U.S. average of $301,466.
In light of the evidence, it’s clear that unaffordable housing prices are a key cause of homelessness across the U.S.
| City | Homeless Rate Rank | Homeless Rate per 100,000 People | Home Value Rank | Typical Home Value |
| United States | – | 175.5 | – | $301,466 |
| Pittsburgh, PA | 50 | 41.8 | 50 | $179,357 |
| Houston, TX | 49 | 43.3 | 33 | $274,314 |
| Cincinnati, OH | 48 | 47.8 | 40 | $232,775 |
| Richmond, VA | 47 | 52.6 | 29 | $301,135 |
| Atlanta, GA | 46 | 52.7 | 25 | $325,680 |
| Milwaukee, WI | 45 | 53.1 | 35 | $266,314 |
| Detroit, MI | 44 | 60.9 | 45 | $209,249 |
| Charlotte, NC | 43 | 65.2 | 26 | $323,297 |
| Buffalo, NY | 42 | 73.6 | 43 | $212,730 |
| Chicago, IL | 41 | 74.3 | 34 | $267,173 |
| Cleveland, OH | 40 | 75.8 | 49 | $183,199 |
| Miami, FL | 39 | 76.8 | 17 | $383,767 |
| Dallas, TX | 38 | 78.3 | 22 | $336,437 |
| Memphis, TN | 37 | 79 | 47 | $203,110 |
| St. Louis, MO | 36 | 79.6 | 46 | $205,694 |
Exceptional Cases: Which Cities Buck the Trend?
For the vast majority of major metros, higher home values are associated with higher rates of homelessness. But certain cities defy the norm.
The tables below show 10 metros: five that manage to have low homeless rates despite above-average home values and five that struggle with high homeless rates despite relatively low home values.
Metros With Homeless Rates Lower Than Expected
| City | Home Value Rank | Typical Home Value | Homeless Rate Rank | Homeless Rate per 100,000 People | Difference in Ranking |
| United States | – | $301,466 | – | 175.5 | – |
| Boston, MA | 6 | $577,160 | 28 | 90.6 | 22 |
| Miami, FL | 17 | $383,767 | 39 | 76.8 | 22 |
| Atlanta, GA | 25 | $325,680 | 46 | 52.7 | 21 |
| Richmond, VA | 29 | $301,135 | 47 | 52.6 | 18 |
| Charlotte, NC | 26 | $323,297 | 43 | 65.2 | 17 |
Metros With Homeless Rates Higher Than Expected
| City | Home Value Rank | Typical Home Value | Homeless Rate Rank | Homeless Rate per 100,000 People | Difference in Ranking |
| United States | – | $301,466 | – | 175.5 | – |
| Oklahoma City, OK | 48 | $195,828 | 22 | 106.5 | 26 |
| Hartford, CT | 32 | $277,401 | 11 | 192 | 21 |
| San Antonio, TX | 36 | $265,249 | 20 | 115.1 | 16 |
| New Orleans, LA | 41 | $227,523 | 25 | 96.2 | 16 |
| Tampa, FL | 27 | $320,187 | 14 | 150.1 | 13 |
It’s not immediately clear how these outliers managed to defy the trend. But a closer look could reveal what approaches are the most productive — and counterproductive — for addressing homelessness in the U.S.
Methodology
Homelessness point-in-time data is sourced from the U.S. Department of Housing and Urban Development. All homeless rates are estimates based on metropolitan area delineations and their corresponding continuums of care as listed by HUD.
Typical home values and typical rent prices are collected from Zillow. The percentage of the population that lives 10% below the poverty line is sourced from the U.S. Census.
For point-in-time counts at the metro level, we’ve aggregated county-level data where available. For two metro areas, Providence, RI and Hartford, CT, only state-level counts were available.
*Correction: A previous version of this report incorrectly cited metro Atlanta’s estimated rate of homelessness, due to the exclusion of surrounding counties. The report has been updated with the correct information.
About Home Bay
Where your real estate voyage begins. Since 2014, Home Bay has helped thousands of readers confidently sail through their next home sale or purchase. In 2021, Home Bay was acquired by Clever Real Estate, a free agent-matching service that has helped consumers save more than $160 million on real estate fees. Research by Home Bay’s Data Center has been cited by The New York Times, CNBC, MarketWatch, NPR, Apartment Therapy, Yahoo Finance, Black Enterprise, and more.
More Research From Home Bay


Articles You Might Like


Frequently Asked Questions About Home Values and Homelessness
One of the biggest causes of homelessness is high housing prices. Analysis of 50 U.S. cities shows that metros with above-average home values have higher homeless rates. Learn more about the connection.
San Jose, California, has the highest homeless rate of any city in the U.S. — about 637 per 100,000 people. That’s about 3.5x higher than the national average of 176 per 100,000 people. See the rest of the top 12 here.
California cities have the most expensive housing prices in the country. The state’s six largest metros have home values nearly 3x the national average, and rent prices are about $1,000 higher than the national average. Learn more about homelessness in California.